 Overview


The world in 2029 will be different, if quite recognisable. But try to visualise it clearly and your mind will naturally project forward from what you know now, so you’ll be wrong. The Horse Manure Crisis of the turn of the 20th century is a good example of this behavioural quirk in action.1
In 1898, the greatest minds of the era met at the world’s first international urban planning conference in New York, a city with around 100,000 horses producing over 1,000 metric tons of manure a day. They estimated the city would be drowned in a sea of manure three-stories high within a few decades; likewise, the streets of London would be buried under nine feet of horse dung. Urban civilisation appeared to be doomed. The conference itself was abandoned after only three days out of a planned 10, due to a lack of agreement over what should be done.
But this particular apocalypse failed to materialise. Horses were on their way out and within 14 years, automobiles outnumbered horses on the streets of New York, substantially reducing the output of manure and the severity of the problem. The forecast, albeit a very reasonable one, was crap.
The tale is a useful reminder that forecasting real-world events is difficult and rarely precisely accurate, even for experts. Yet, in the financial world at least, the practice of forecasting capital market returns has real value. We don’t expect these numbers to be 100 per cent accurate, instead we are predicting what might be reasonable to expect.
What are long-term forecasts used for?
At Fidelity, we use long-range market forecasts to help assess the feasibility of client objectives and to help design investment strategies to meet those client objectives.
For example, clients come to us with return targets they wish to achieve over a time horizon and under some constraints. Initially, the long-range forecasts are used to determine if we think that is likely to be achievable or whether alternative approaches need to be considered. The forecasts are then used as a starting point for investment solutions design.
What we talk about when we talk about 10-year forecasts
Forecasting the long-term performance of different assets is a complex process. To make it manageable, it’s useful to break down expected returns into building blocks. The core building block is the risk-free rate, or return on cash, which is the starting point for expected returns on all assets.
There is a theoretical link between an economy and the price of financial assets; a country’s interest rate should be similar to the growth rate of economic output. The interest rate is defined as the return on a risk-free investment, while risk-bearing investments have an additional premium.
As a result, to project 10-year investment returns, we forecast the future rate of nominal GDP growth, project the interest rate given that path and build a projection for the risk-asset premium on top of that interest rate.
Chart 1: Building a 10-year capital market forecast
 .
.Source: Fidelity International, 2019
For all input variables in our models, we consider the future in three phases: the short-term, a long-term equilibrium state and a transition from the former to the latter. Equilibrium is a theoretical state of the world where economic growth, employment, and inflation are stable. The concept of equilibrium only applies in the distant future when averaged over many economic cycles. It is far less relevant in the short-term, where instead we rely on the analysis of relevant Fidelity experts. We use statistical models to project the convergence from short-term to equilibrium.
In the shorter term, these economic cycles lead to fluctuations of the risk-free rate and risk premia. Beyond this, we project paths towards our equilibrium estimates, which we use to compute returns.
Forecasting nominal GDP
Put simply, economic output is the value of all that a country produces. This can be considered as the number of things that are made, multiplied by the price of each one. Therefore, the rate of growth of economic output comprises real GDP (output measured in terms of quantity) and inflation.
Forecasting real GDP
Short-term forecasts are driven by our proprietary economic indicators, including the Fidelity Leading Indicator (FLI) and the Gauges of Economic Activity in Real-time (GEARs). We then use a long-term model to provide an expected path from our short-term outlook to equilibrium where growth is stable. The equilibrium state of economic growth is estimated by considering physical capital, labour force size, technological progress and productivity gains from education. This equilibrium takes no account of an economic cycle but instead measures what such a cycle oscillates around.
Chart 2: US growth projection
 .
.Source: Fidelity International, 2019
Forecasting inflation
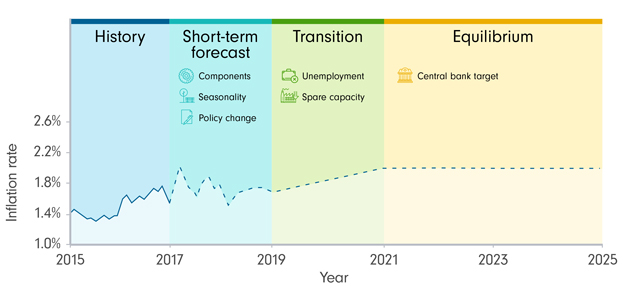
Fidelity has a large index-linked bond business for which inflation analysts make short-term forecasts. These analysts consider components of the inflation index, assessing recent trends and seasonal price patterns in the component goods and services. They consider policy changes, including tax changes and pre-announced price changes.
For forecasts longer than two years, we switch to an economic model of inflation. This long-term model considers economic indicators such as slack in the labour market, to determine the path of inflation.
Chart 3: How we make US inflation forecasts
 .
.Source: Fidelity International, 2019
Cash
A country’s interest rate is set by the central bank, usually within a monetary policy framework. Whilst in the short-run, that monetary policy is governed by an outlook for the country’s economy - especially inflation - in the long-run the equilibrium interest rate should, theoretically, be slightly lower than the rate of economic growth.
To project a path of interest rates from today to equilibrium, we take a view on future central bank policy. First, we consider what the near term monetary policy of each central bank is likely to be. This requires an analysis of the communication from each central banks’ monetary policy committee. Second, we consider how the central bank will react as our projected growth and inflation scenario progresses. Finally, we project convergence of the interest rate to equilibrium.
Bonds
Bonds are split into government bonds and corporate bonds, where government bonds comprise the risk-free rate plus a term premium and corporate bonds are modelled as government bond yields plus a credit spread.
Government yields are made up of the risk-free rate plus a term premium, which is set using the views of Fidelity’s economists, fund managers and analysists in the short term, and trending towards an equilibrium rate in the long term.
Corporate yields are modelled as government yields plus a credit spread. This spread is an expression of the premium investors demand for the extra risk, based on the view that corporate bonds may have a greater risk of default, and are traded in less liquid markets, than sovereign bonds. Default rates are modelled as a function of interest rates and GDP. Once computed, liquidity and credit premium can be derived as a function of them. Summing these elements generate spreads which are projected by rating (AAA to C) and by maturity.
Government and corporate bond index yields are computed by aggregating across credit ratings and maturities.
Equity risk premia example
The equity forecast is based on the corporate fundamentals of every company in an index. A short-term view of those fundamentals is derived using the estimates of Fidelity’s teams of equity analysts. We then use a model that is guided by our projections for economic growth, inflation and bond yields to predict a path from this short-term expectation to a long-term steady state where earnings growth, pay-out ratios and price-earnings ratios are constant.
Chart 4: How we make equity market forecasts
 .
.Source: Fidelity International, 2019
Future behaviour
Capital market assumptions are intended as a general guide to the future, rather than a detailed street map. It is close to impossible to forecast the future precisely, so instead we try to reflect what would be a reasonable assessment of the capital markets in 10 years’ time. The Capital Market Assumptions (CMAs) take into account the limits of the human mind’s ability accurately to weigh future outcomes.
Corporate executives and investors often rely too much on their own experience in making forecasts, prioritising the inside view over the outside view. Academics who study decision making examined how executives make strategic choices and found that they often depend on a single analogy or a handful of experiences that readily come to mind. Microsoft Founder Bill Gates has provided a few good examples. In 1981, he reportedly said: “No one will need more than 637KB of memory [RAM] for a personal computer. 640KB ought to be enough for anybody.” Twelve years later he was quoted as saying: “The internet? We’re not interested in it.5” Luckily for him, and the company’s shareholders, his outlook stayed flexible.
When calculating the CMA’s, we don’t just extrapolate what’s happened in history. We take the views of central banks, along with Fidelity’s economists and analysts to project future paths to get to these return expectations.
Conclusion
Narratives are useful in forecasting. They help identify opportunities for action based on a cause-and-effect analysis. However, they must be balanced with robust design and statistical rigour to avoid the sort of myopic thinking to which humans are prone. We don’t expect hindsight to prove our forecasts were perfect, but they remain a critical tool for solutions design and investment planning when built and used in the right way. So, the world of 2029 might not match the estimates to the decimal point, but we can be confident the forecast is manure free.
References
1: The Great Horse Manure Crisis, Foundation for Economic Education
2: Mauboussin, M., Callahan, D., Majd, D. (2016), The Base Rate Book
3: Moore, D., Haran, U. (2014), A Better Way to Forecast
4: Schacter, D. L., Addis, D. R., Buckner, R. L. (2008). Episodic simulation of future events: Concepts, data, and applications.
5: FT Briefing: Microsoft and the internet (2005). https://www.ft.com/content/b33397b8-5137-11da-ac3b-0000779e2340

