 Overview


This content was correct at the time of publication and is no longer being updated.
- Protecting biodiversity is the next big target for sustainable investing
- But investors have neither robust tools to measure it nor meaningful targets to aim for
- New research uses sound recordings to track the richness of biodiversity
- It promises a standardised measure for biodiversity that will help investors better determine risks
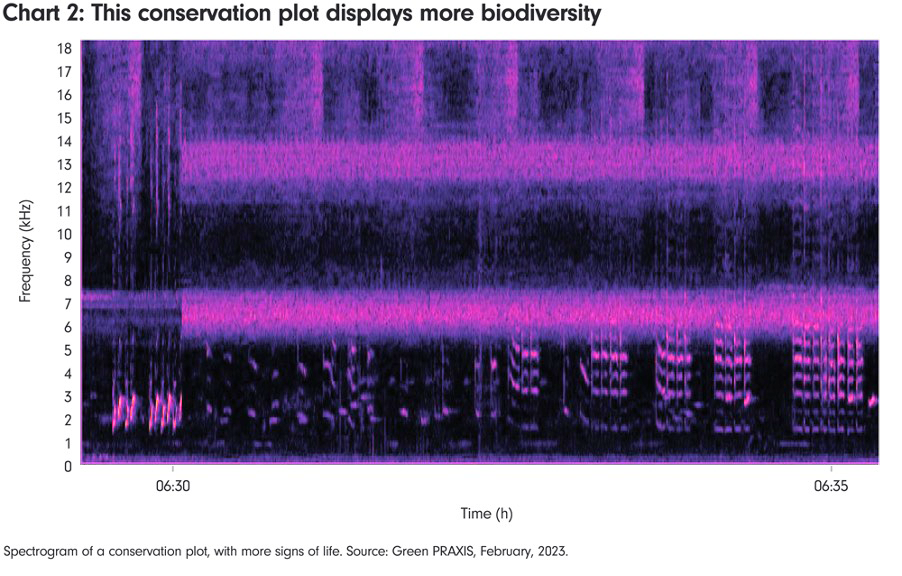
Aix-en-Provence, France, February 2023. A young environmental researcher plays a series of wildlife recordings taken on a palm oil plantation in Borneo. The room fills with the call of hornbills and chirruping of crickets. On the screen, two black rectangles flicker with colours. These are spectrograms, a visual representation of the sounds we can hear.
“The black is silence,” explains the researcher, Iván Beltrán, one of the team at French start-up Green PRAXIS, which is conducting the study. The spectrograms allow the team to see at a glance anything that warrants further examination. With enough experience it is possible to take one look at an image and pick out species groups as well as tell what time of day a recording was made.
Towards the bottom of the chart is a thick red line.
“This band is insects.”
Just below it we also see the call of a solitary bird.

Iván points to the second spectrogram.
“Here there is an insect band as well but in the middle you see a lot of birds.”
Watching the presentation is a small group of investment professionals. They have come to Aix to hear an update on the research they have sponsored into using these sound recordings to measure levels of biodiversity. In other words, capturing not creatures but the noises creatures make - a field of study called bioacoustics.
At present, the standardised tools financial institutions use to measure biodiversity tend to rely on modelling the potential impact an activity will have, based on what is known about the location where it happens, rather than on direct measures of impact. The goal of the project is to develop a fast, affordable, and reliable way to assess directly the state of biodiversity in a given location, both in terms of species richness (how many different species groups there are) and species abundance (how many of each species group), and so capture the kind of biodiversity data investors need to make intelligent decisions.
“Solving the biodiversity challenge may surpass decarbonisation as the largest investment megatrend of our lifetime,” says Velislava Dimitrova, a portfolio manager at Fidelity International. “The data we have available to us currently around biodiversity is insufficient to be able to estimate the risks we are taking within our portfolios.”
Five months earlier…
Borneo, Indonesia, September 2022. After an eight-hour drive over rough terrain and some snatched sleep on the floor of a spartan accommodation block, Fidelity analyst Minlin Lee awakes to the sound of gibbons calling. It’s an apt reminder of the reasons for this trip. Minlin has secured permission from a palm oil producer through her coverage of the company as an analyst to conduct a pilot study on its land, comparing the bioacoustics of production plots on which it plants its crop with both the conservation areas it manages and a control plot outside its concession.
“Biodiversity is increasingly an important topic of discussion for the companies I cover,” she explains. “Especially when it comes to palm oil plantations.”
A few hours later, Minlin is squelching through the jungle mud, boots cracking twigs, following the research team under low-hanging boughs and over makeshift log bridges. They are heading into the forest to a test site to check on microphones placed the previous day. As they walk through the trees, researcher Noreen Blaukat explains the concept behind bioacoustics.
“Sound is used by many animal groups,” says Noreen. “We can use that as a proxy for biodiversity levels.”
“How does it compare to other monitoring methods?”
“Bioacoustics is non-invasive. You just leave the recording device in place, so you don’t need to have people walking around in the forest and potentially disturbing wildlife. You can also use it for large areas and long time periods and get insights over different times of the day or different seasons.”
It is this scalability that makes bioacoustics a potential game changer. Current methods for measuring biodiversity can be highly labour intensive and time consuming, often requiring experts to physically count how many different species they see and how many of each species. The result is a trickle of data when the world needs a torrent.
The team arrives at the test site.
“It’s not so bad here,” says Patrick McLean, the chief technology officer. “The first control plot was horrible. Lots of ants.”
“Patrick had one in his shoe!”
“And they bite,” Patrick confirms. “They bite hard.”
Strapped to the base of a tree is a black plastic box, around 20cm across, from which several wires snake out across the jungle floor to two tripods, one on either edge of the 20-metre-wide recording site. Each tripod holds a pair of microphones, one close to the ground, the other higher up.
“The idea is to capture different elements of the soundscape,” explains Noreen.
Patrick opens the box and carefully removes the recording device and its sound card. Every movement is measured, deliberate, precise, like defusing a bomb.
Nearby, a colleague is wrapping a tape measure round a tree trunk.
“One of the things that’s important to us is to get an assessment of the density of vegetation immediately around the microphones,” says Patrick.
That includes identifying all trees wider than 10cm in diameter, as well as taking video and photos of the site, all of which will enable the team to assess the effects of sound absorption. The height of the canopy also affects the number of birds or bats the microphones are likely to pick up. The team also takes temperature and humidity readings. The better they understand the differences between plots, the better they can account for them in their analysis.

Noreen takes the sound card and puts it into her laptop.
“We started yesterday at 10.16,” she says, pointing to the first recording. “The last file is when we arrived, so everything is there.”

The recording equipment appears to be in good working order. That’s more than Fidelity’s videographer KJ can say about his camera, which is struggling in the tropical conditions.

Satisfied, the team heads off to check the next site. There are ten test sites in total, with four microphones on each. In total, they will collect 276 hours of recordings over a six-day period, covering conservation areas, productions plots, and a control area. Ideally the control area would be a primary forest. However, as these were all cleared in the 1980s, the control for this study is secondary forest that has not been logged in the past 10 years and, unlike the conservation areas, is not monitored by the palm oil company.
The analysis
Aix-en-Provence, France, February 2023. Back in the Green PRAXIS offices, Patrick sits down with Fidelity sustainable investing analyst Charlotte Apps to share the team’s research. Charlotte starts by asking about the obvious challenge:
“You have a lot of data. How do you get it all in a single place?”
Patrick explains that listening to every recording in full would not only be impractical but pointless too. Humans can only hear part of the information, from between 20Hz to 20kHz. Bat calls, for example, are mostly at much higher frequencies that we can’t pick up. So another approach is needed.
The answer lies in acoustic indices, the workhorses of the bioacoustics researcher. An acoustic index takes a particular feature of an audio sample and summarises it using a mathematical formula, much as a financial analyst might use ratios and other metrics to make sense of a company’s accounts. Two big advantages are that you can use software to automate much of the work, and that equipment can pick up audio beyond the human hearing range.
After comparing a variety of indices, the research team settles on three. The first is the Acoustic Complexity Index, which measures changes in amplitude from one time period to the next. Essentially, it’s a measure of loudness.
But, stresses Patrick, this is analysed in bands set by frequency. “How much is happening down at 5kHz, what’s happening at 10, 15, and so on.”
This is the first step towards separating out different species groups and capturing the diversity present in a recording.
The second acoustic index, temporal entropy, measures energy concentration within a given time period and represents a sound’s ‘structure’.
“Noise is unstructured sound,” says Patrick, who demonstrates with a quick blast of white noise. “‘Tweet, tweet’ is structured sound.”
The third index measures the number of acoustic events per second above a given threshold, used to pick up repetitive sounds like bird calls.
Each index is then assigned a colour - red for volume or ‘loudness’, green for entropy or ‘structure’, blue for event count per second or ‘repetitiveness’. Using these colours, the team can create what are called Long Duration False Colour (LDFC) spectrograms, which show the soundscape based upon the features the chosen indices measure.
In the images below, each created from a single day’s recording, the large amount of red on the production plot graph reflects the more intense acoustic activity at that site. In other words, it was noisier. By listening to the relevant recordings, the team identifies the culprit: cicadas, a large insect responsible for much of the din heard among the palm oil monoculture of the production plot.
That may be because cicadas are adaptable and can tolerate degraded environments like agricultural plantations, or it may also be their sound carries further among less dense vegetation.

In contrast to the production plot, the control and conservation plot graphs show more blue, reflecting the significantly higher number of acoustic events per second at those sites.
“Conservation plots showed a very different profile from production plots and were qualitatively closer to the control forest plot over the course of the recording campaign,” confirms Green PRAXIS Co-Founder and Chief Operating Officer Jerome Di Giovanni.
Analysis of the recordings reveals periods of several hours during the day when only insects could be heard on the production plots, supporting the notion of an altered animal community in the areas where palm oil is produced intensively.
“What’s more,” adds Jerome, “in-depth comparison of indices values shows that the calculated parameters for conservation areas often lie in between the values for production and control plots. It suggests that, at this stage, species abundance may still be lower in conservation plots than in the control plot outside the concession.”
Putting bioacoustics to work
A goal of the project is to take the vast amount of raw data you get from a microphone in a jungle and package it in a way that is both ecologically meaningful and straightforward to interpret. For now, however, the work remains very hands-on and time consuming. The next stage of the project is to develop an easy-to-read visual representation of the results. It is this ability to take direct measurements and analyse them quickly that will be useful to those wanting to track species diversity, including investors.
As Fidelity portfolio manager Velislava Dimitrova explains: “At present, two companies we invest in in the same sector might appear to be spending similar amounts of time and resources on conservation efforts, but it is very difficult to compare their achievement – the impact of those efforts. There is just no widely adopted, standardised way to measure companies’ impact on the environment.”
The aim of the bioacoustic work is to change that by developing a methodology that is both scalable and economically viable for companies to adopt. Investors want to understand how the activities they help fund both change and depend on biodiversity.
“This study shows that bioacoustics can offer an efficient way to measure biodiversity,” says Fidelity’s Global Head of Sustainability Jenn-Hui Tan. “And it’s only once something can be measured that it can be changed, so we’re excited about its real-world application.”
Not that bioacoustics will be a silver bullet. Neither it nor any other metric will emerge as biodiversity’s answer to ‘carbon dioxide equivalent’, the metric which has become the standard for the disclosure of greenhouse gas emissions. Nature and its processes are far too complex for that; it will take a suite of solutions to begin to turn the tide.
Nonetheless, the ability to deploy low-cost, rapid acoustic surveys at scale will still be pivotal, allowing companies to measure and disclose the impact of their activities, and giving investors a tool to identify the best performers and ask tough questions of those that lag behind.
“I firmly believe that with more data we will be able to invest in a way that contributes faster to solving the biodiversity loss challenge,” says Velislava.
“Many animals are heard more than they’re seen,” adds Minlin, reflecting on her time in the jungle. “When you go there and you stand on a plantation, on a conservation site, and then you go well away from those to the control plot, you can really hear the differences between all three. If we can turn that into hard quantitative data, we can win the arguments we need to win with management teams and protect the land that needs to be protected.”
In Aix, the research goes on. Further field work is planned, and Fidelity and our co-sponsors continue to provide support. Watch this space. Or should that be, keep an ear out.
With thanks to Green PRAXIS; to Professor Hervé Glotin, Head of the DYNI research team at LIS, University of Toulon; and to Professor Gianni Pavan, Director of CIBRA, University of Pavia.