 Overview


This content was correct at the time of publication and is no longer being updated.
To hedge or not to hedge? US-China trade tensions, unexpected central bank pivots, and the broader health of the global economy are raising more questions for investors about how to position for volatility.
For answers, we took a closer look at two big developments and what they mean for markets: yield curve inversion in US Treasuries (as a historical recession predictor), and the recent impact of trade wars on the cost of stock hedges in the US versus China. We use these two cases to examine whether it’s a good time to hedge portfolios against big market moves.
In general, it makes sense to buy put options - or the right to sell a security back at a pre-determined price within a given period - when you expect the market volatility will be greater than what is currently priced into the options for the same period (this is also known as implied volatility). In other words, you generally want to buy put options when implied volatility is low (meaning it is under-pricing what you think the actual future volatility will be) and sell them when implied volatility is high.
Yield curve inversion
The shape of the US Treasury yield curve i.e. the difference between yields on longer and shorter dated instruments, have historically been a fairly accurate precursor signal to a recession in the US. So far, the curve between the 10-year bonds and 3-month Treasury bills has recently inverted, while the difference between 10-year and 2-year yields has hovered just above zero for the past year.
But what does a yield curve inversion signal for stocks and volatility? Looking backwards, stocks have a 50/50 chance of being up or down 24 months after the yield curve inverts (Chart 1). That doesn’t tell us much. But look beyond price, at volatility: market volatility has risen in seven of the previous eight yield curve inversions (Chart 2). The trend isn’t evident in the first 12 months following a yield curve inversion; instead the correlation is strongest from 12 months to 24 months after an inversion.

Source: Bloomberg, Fidelity International, June 2019

Source: Bloomberg, Fidelity International, June 2019
This timing tends to align with the onset of recession, which historically has also typically lagged yield curve inversions by several months. One recent paper by the St. Louis Fed calculated that recessions tend to occur 10 to 18 months after an inversion (the study in question used the 10-year and 1-year curve, and measured recession by employment as opposed to GDP).
All of this suggests that timing matters. When thinking about hedging with options, it pays to be mindful that any signalling power a yield curve inversion has over market volatility also carries with it an implicit - and not insignificant - lag effect. While hedging costs for major stock markets sit at multi-year lows, they can add up over time. Investors should tread carefully when buying protection for their portfolios.
Trade wars- more concerning to bond investors?
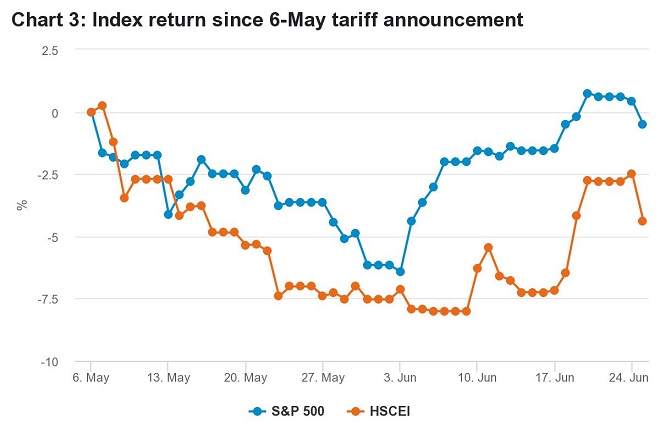
Despite the view in some sectors that the trade war and related tariffs stand to hurt China more than the US, and the recent underperformance of Chinese stocks vs. US stocks (Chart 3), the cost to hedge Chinese stocks with put options has not increased as much (Chart 4).
Source: Bloomberg, Fidelity International, June 2019

Source: Bloomberg, Fidelity International, June 2019
Why is this? One reason could be expectations (justified or not) that major market drops in China will trigger some form of official support for asset prices, i.e. - a ‘national team’ effect. When we look more closely, we see another possible explanation: the popularity of structured products among Hong Kong retail investors seeking income. Increased sales of such products can cause an artificial oversupply of put options in the market, thus having the effect of capping the price of hedges.
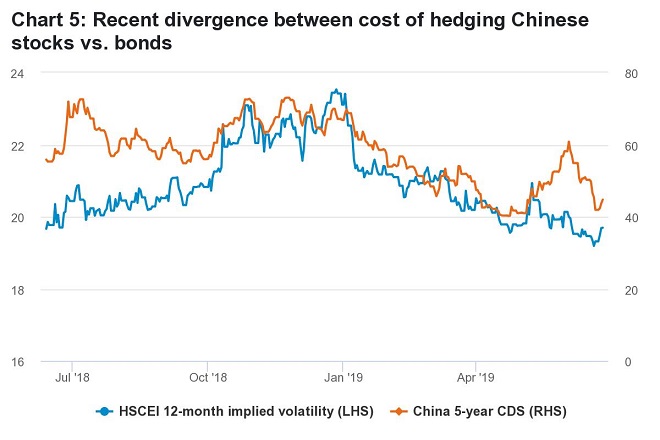
Both explanations are supported by what we see in the market for credit default swaps (CDS), which represent the cost to hedge bond portfolios. Usually the cost of China’s CDSs have shared a tightly correlated relationship with the cost of equity put options, as they both represent ‘fear levels’ among investors.
The divergence in recent performance between CDSs and put options (Chart 5) suggests that both the national team effect and oversupply of retail investors’ selling are less applicable to credit markets than equity markets in China. In other words, the cost to hedge China’s government bonds has increased materially despite equity options staying cheap - implying that bond investors are more fearful than stock investors.
Source: Bloomberg, Fidelity International, June 2019
Key takeaways:
- Yield curve inversion historically doesn’t predict stock market direction, but has previously foreshadowed an increase in market volatility 12 to 24 months later.
- While hedging costs are near multi-year lows, they can add up over time, so investors should tread carefully when buying protection. Timing matters.
- Implied volatility in Chinese stocks has remained muted relative to US stocks, but China’s credit markets are signalling more fear recently.


